- /
- /
- /
How to Create a Polling Game in PowerPoint
It will be more fun and engaging for students to participate in a polling game which is a team competition. Polling game can be done in PointSolutions Desktop easily and quickly. PointSolutions Desktop software allows students to sign up for different teams, show the top individual participants, display teams rank as well as participants on each team with the most points.
Note: You need to create polling questions before setting up the “Team Assignment” slide. Please see the tutorial “How to Create PowerPoint Polling in PC” or “How to Create PowerPoint Polling in Mac.”
Part I: Setup Team Assignment
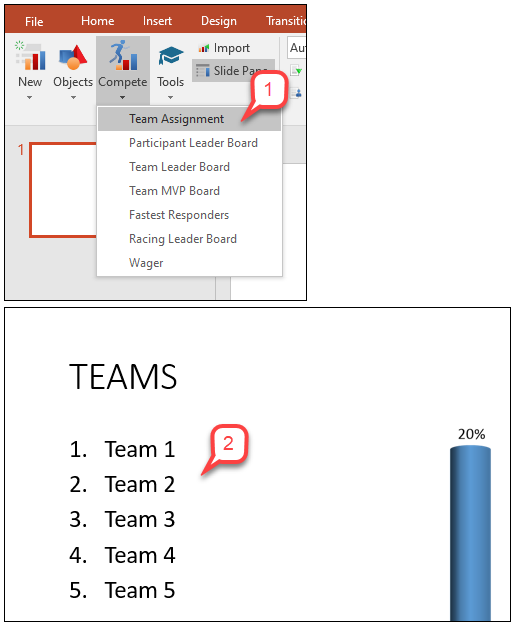
A team assignment slide contains a question text box, an answer text box that allows for up to 10 answer choices (team names) and a chart. The team assignment slide assigns participants to teams for competitions and is also considered a demographic slide.
- From the PointSolutions ribbon, click the Compete icon and select Team Assignment.
- Type the question or statement and up to 10 possible team names.
Note: You can create polling questions before setting up Team Assignment slide.
Note: After the Team Assignment and polling question slides, you now have the option of inserting Participant Leader, Team Leader, and Team MVP Board slides as often as you would like to see the updated score.
Part II: Setup Participant Leader Board
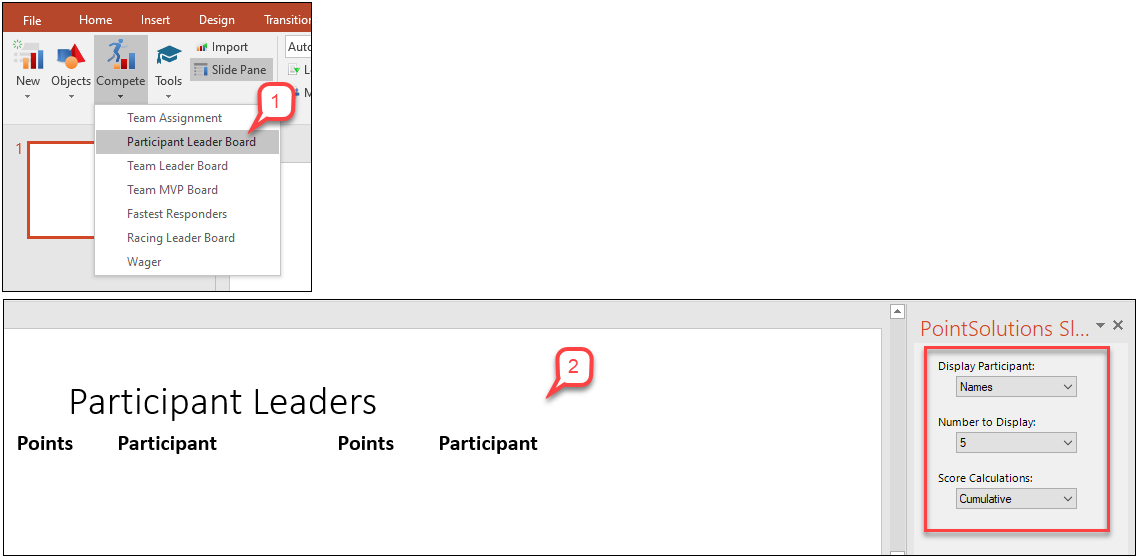
A participant leader board displays the top individual participants ranked by their total points. This slide updates dynamically after each question.
- From the “PointSolutions” ribbon, click the Compete icon and select Participant Leader Board.
- Participant Leader Slide.
Note: Press the tab key on the keyboard to view more participants in the participant list.
Note: In Slide Preferences, instructors can select Display Participant, Number to Display, and Score Calculations.
Part III: Setup Team Leader Board
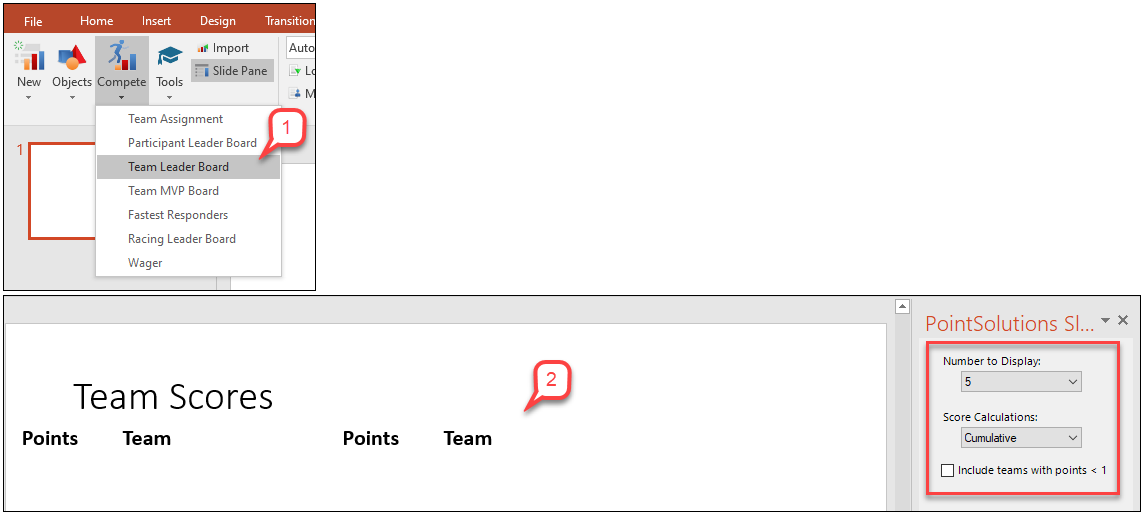
The team leader board displays teams ranked by their total points. Team scoring works by calculating the point total for all of the participants on a team and then dividing it by the number of participants.
- From the “PointSolutions” ribbon, click the Compete icon and select Team Leader Board (by default, leader boards accumulate).
- Team Scores Slide.
Note: Press the tab key on the keyboard to view more participants in the participant list.
Note: In Slide Preferences, instructors can select Number to Display, Score Calculations, and Include team points <1.
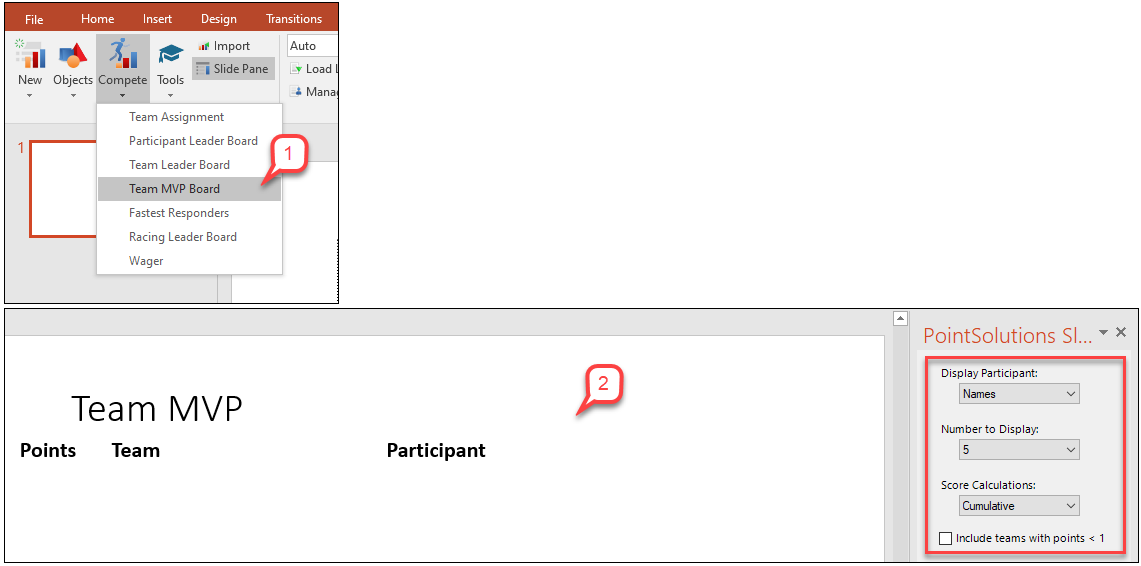
Part IV: Setup Team MVP Board
The Team MVP Board displays the participant on each team with the most points. Most likely this slide would be inserted at the end of the presentation.
- From the “PointSolutions” ribbon, click the Compete icon and select Team MVP Board.
- Team MVP Slide.
Note: Press the tab key on the keyboard to view more participants in the participant list.
Note: In Slide Preferences, instructors can select Display Participant, Number to Display, Score Calculations, and Include team points <1.
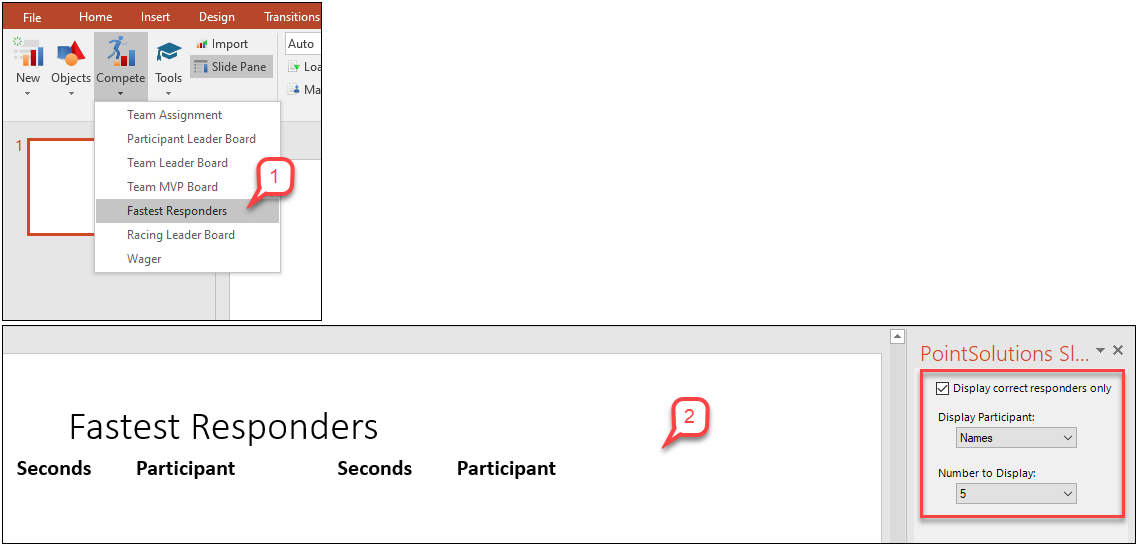
Part V: Setup Fastest Responders
The fastest responders slide displays the individual participants who responded correctly and fastest to the most recent question. This feature requires a correct response or point value and is updated dynamically after each question.
- From the “PointSolutions” ribbon, click the Compete icon and select Fastest Responders.
- Fastest Responders Slide.
Note: Press the tab key on the keyboard to view more fastest responders.
Note: In Slide Preferences, instructors can select Display correct responses only, Display Participant, and Number to Display.
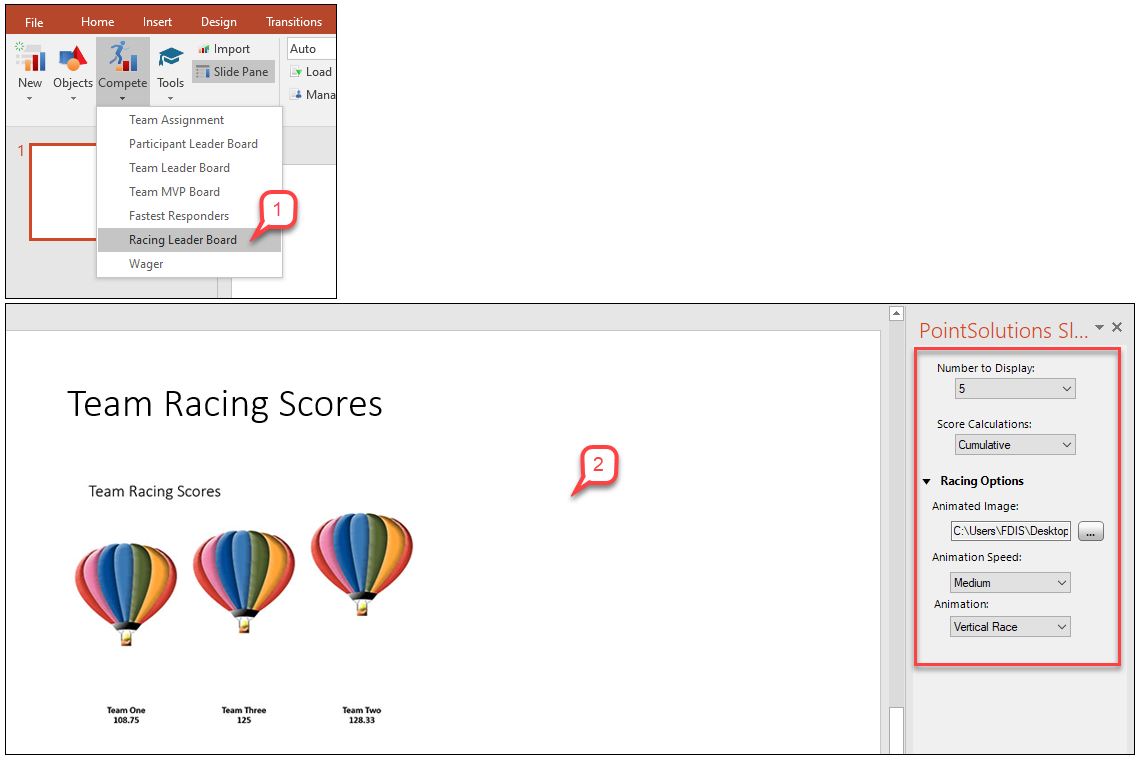
Part VI: Setup Racing Leader Board
The racing leader board slide presents a visual representation of the team scores. An image to represent the teams is selected in the Slide Preferences Pane. When the slide is advanced, the images move in relation to the number of points earned.
- From the “PointSolutions” ribbon, click the Compete icon and select Racing Leader Board.
- Racing Leader Board slide
Note: In Slide Preferences, instructors can select Number to Display, Score Calculations, and Racing Options.
Part VII: Setup Wager
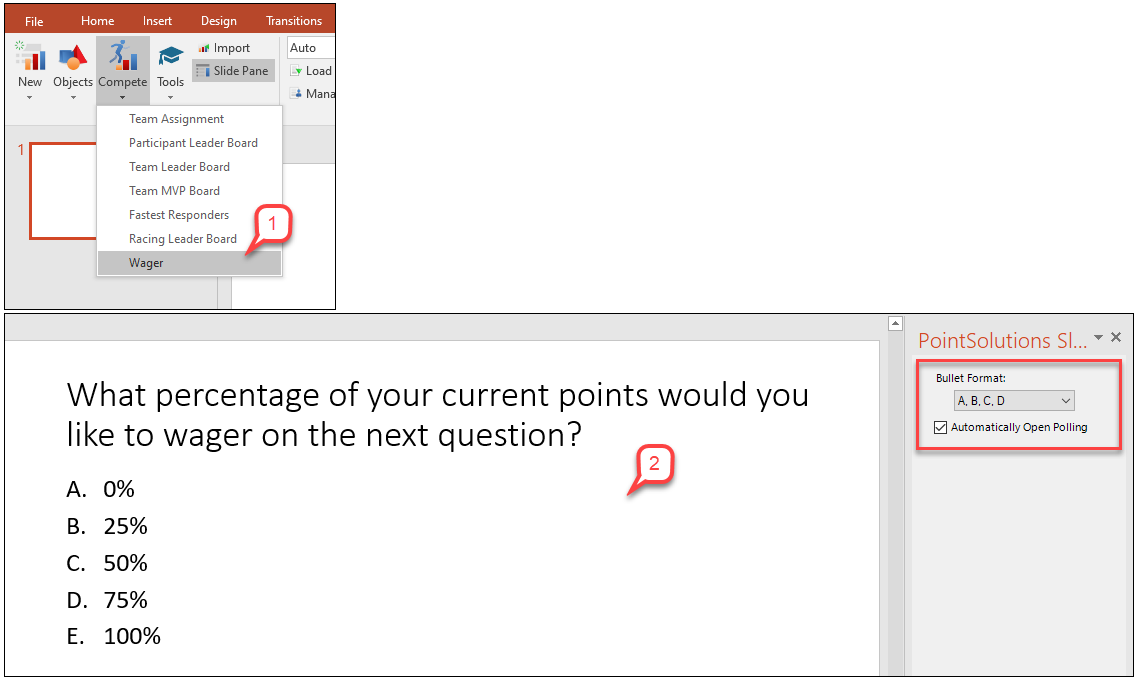
The wager slide allows participants to wager a percentage of their points on the next question slide. If the participants fail to correctly answer the question, the amount of points wagered is lost. If the participants successfully answer the question, they are awarded that percentage of points. If there is a correct answer value for the question, participants are also awarded those points in addition to the points wagered.
- From the “PointSolutions” ribbon, click the Compete icon and select Wager.
- Wager slide.
Note: In Slide Preferences, instructors can select Bullet Format and Automatically Open Polling.